Development of concentration dependent sensors
In this section the construction and evaluation of Spinach-SAM sensors with modified concentration dependence is presented. Combining several constructs with significant differences in Kd is expected to broaden the dynamic range of the full construct.5 This is illustrated in Figure 1.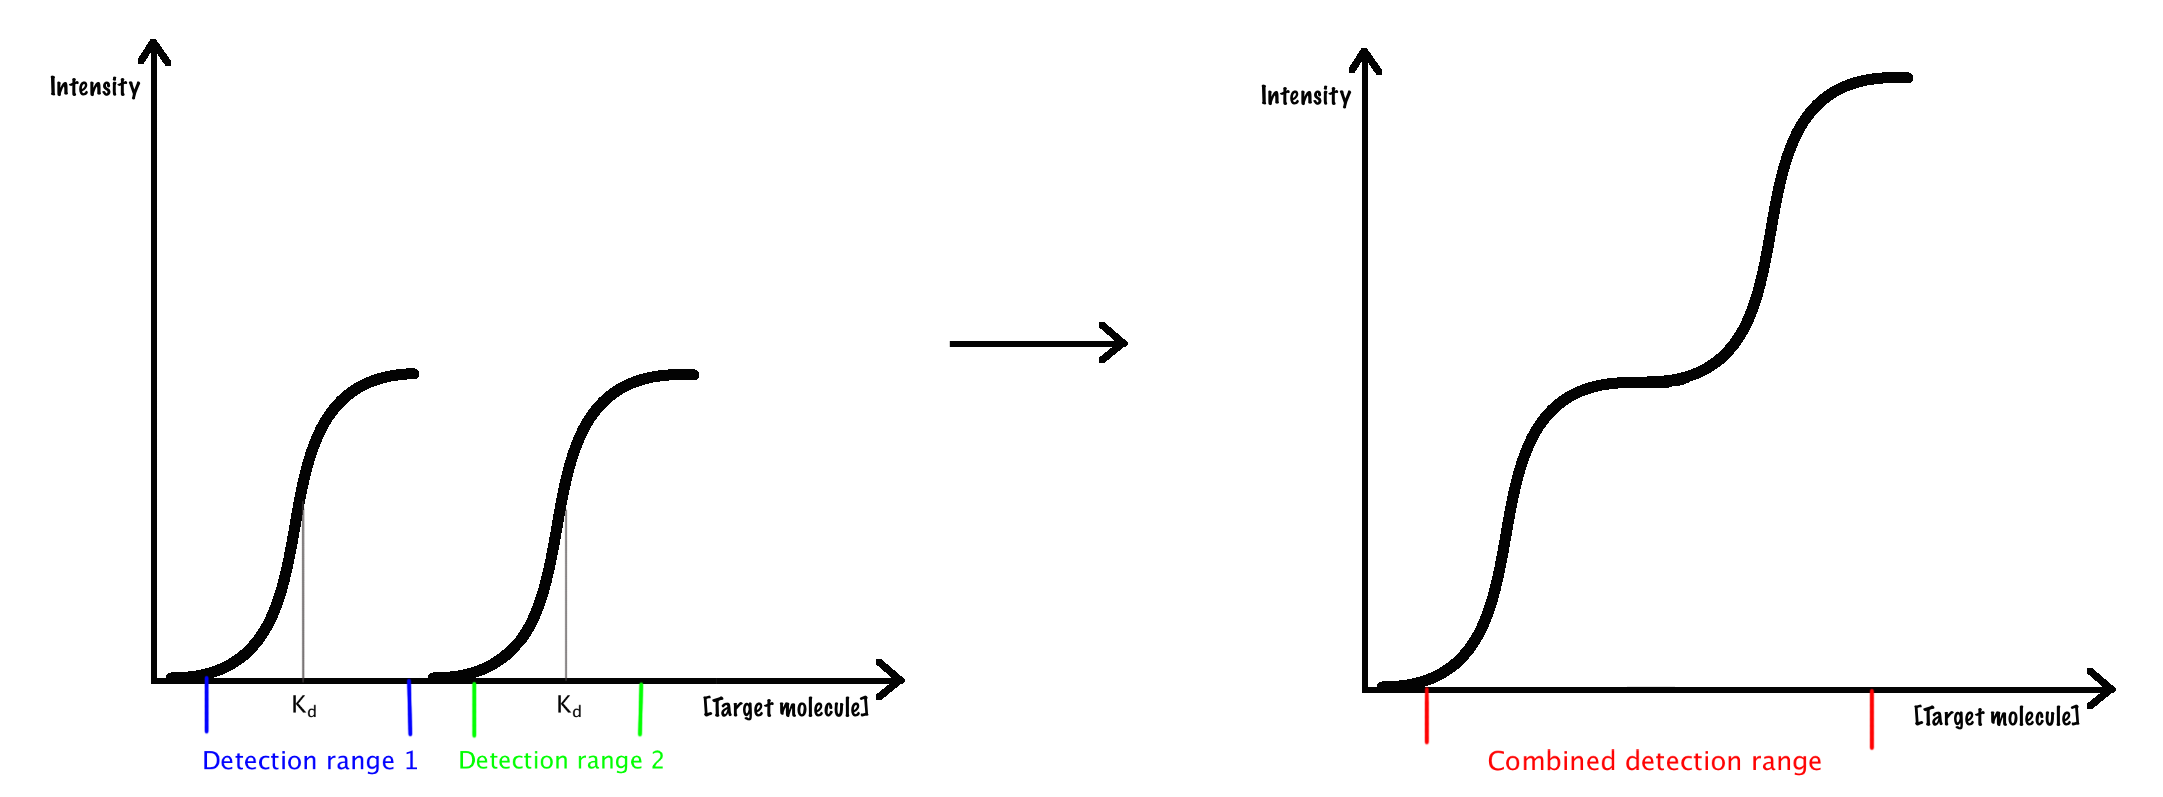
Design
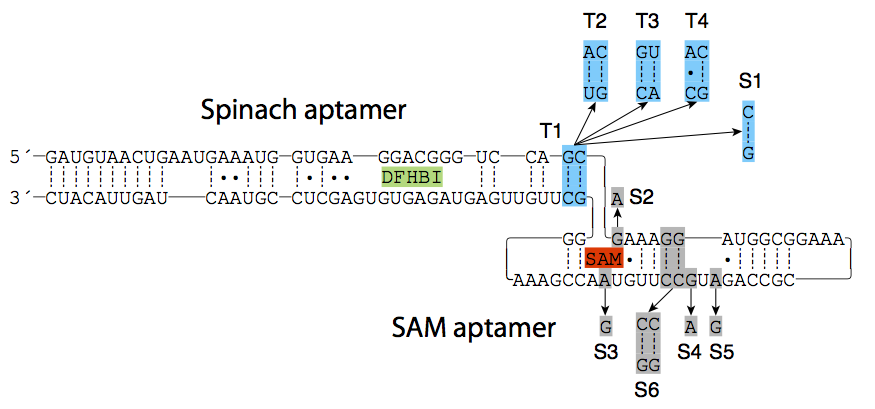
The basis of our study is the original construct by Paige et. al in which the Spinach aptamer is linked to a SAM aptamer through a linker region.3 We hypothesized that changing the linker region between the aptamers or introducing mutations in the SAM aptamer would influence the concentration dependency of the biosensor. Four constructs were created with mutations in the linker region (T constructs) and six constructs were created with mutations in the aptamer recognizing SAM region (S constructs). Two different linker regions were used for the two different classes. The most effective linker was just one GC base pair and was used in the S constructs.3 The second most effective linker region was 2 base pairs; a GC and a CG bp. This region was mutated for the T constructs.The purpose of the mutations in the linker region was to lower the stability of the stem thereby affecting the concentration dependency. Hence one of the GC pairs was exchanged with an AU base pair (construct T2 and T3) or an AC mismatch (construct T4).
The wild type SAM detecting aptamer is called S1. In the construct S2 and S3 one base in the metabolite recognition loop was mutated. This was expected to affect the affinity for the binding of the SAM metabolite. In the S4 and S5 constructs, one base in the second loop was mutated. This was expected to affect the stability of the tertiary structure of the aptamer-SAM metabolite complex. In the S6 construct two GC-basepairs were switched, which was expected to affect the folding of the aptamer. The different mutations are shown in Figure 2.
Assembly PCR and transcription
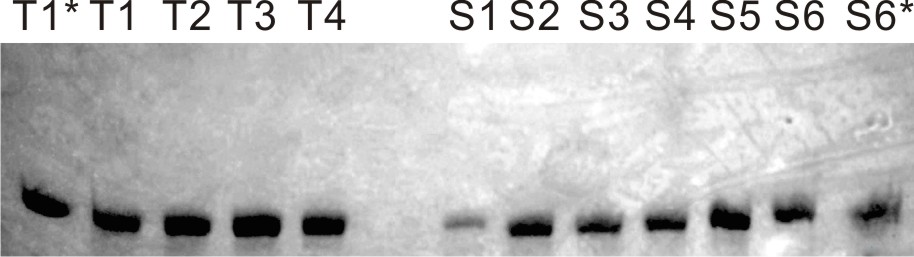
Due to the length of the RNA aptamers, smaller DNA fragments were purchased and assembled into the full-lenght DNA counterpart. This was done by assembly PCR and is illustrated in the Figure 3, left. The DNA was then amplified by PCR. In the DNA sequence a T7 promotor was included. This was used for transcription of the DNA into the RNA aptamers.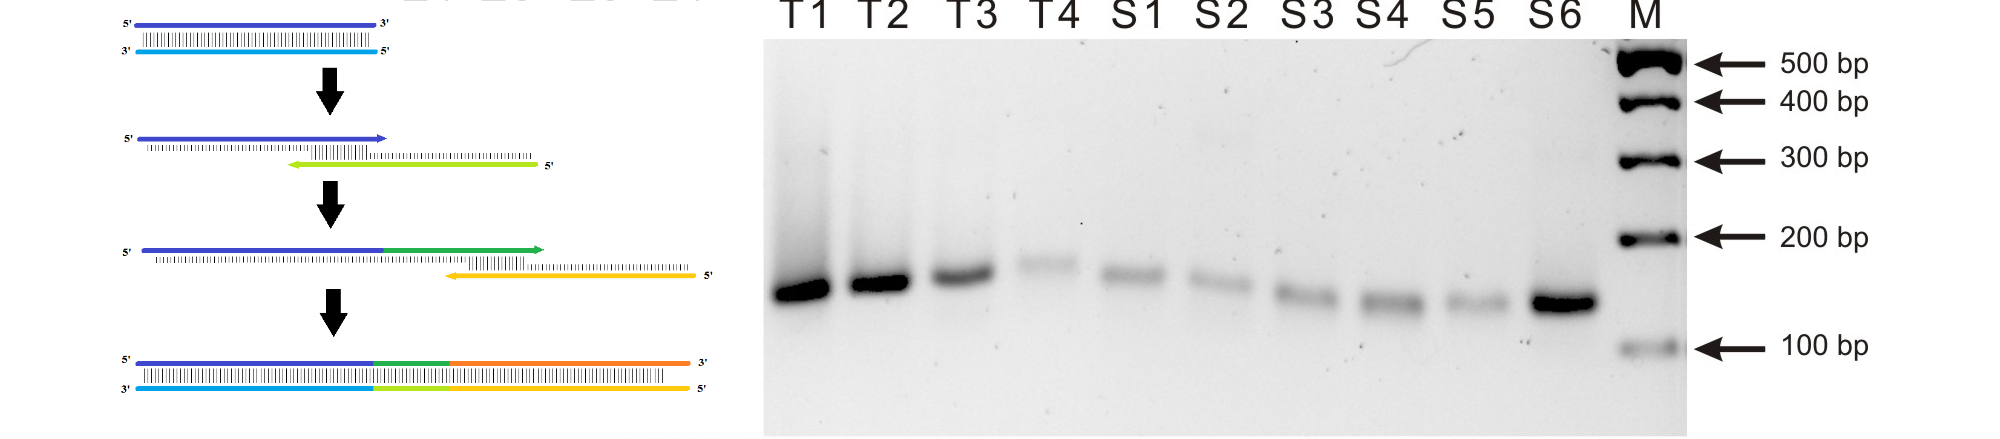
Measurement of Kd values
The mutated RNA constructs were tested for concentration dependency by a series of measurements of fluorescence in response to the concentration of SAM.The RNA and DFHBI concentration were kept constant at 0.26 µM and 2.6 µM respectively, while the SAM concentrations were increased from 100x to 10000x the concentration of RNA. The relative fluorescent enhancement for the 10 constructs are shown in Figure 5.
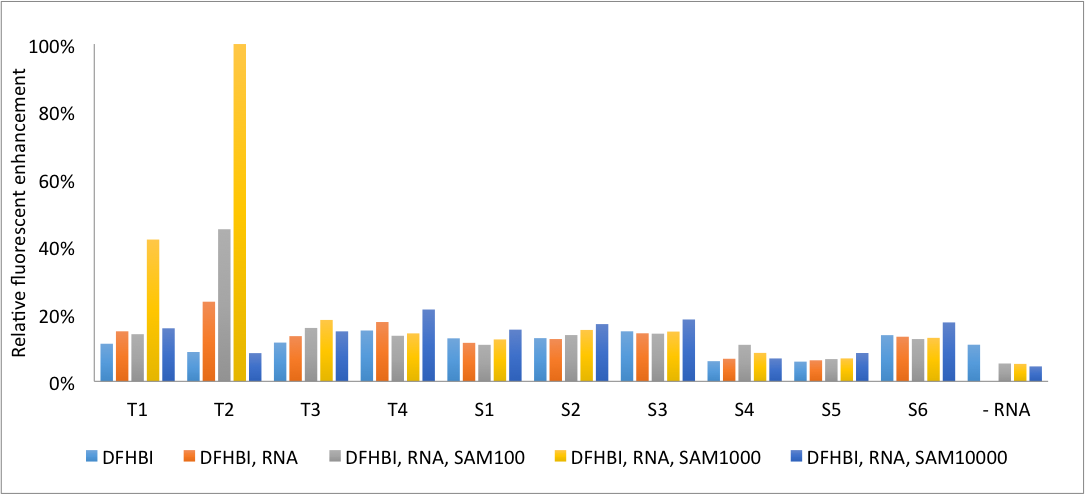
Some mutations induced a fluorescence response while others did not. The constructs with mutations in the detection aptamer showed no enhancements in fluorescence. This may be the result of the high binding specificity of the aptamer, which means none of the bases can be interchanged without disrupting binding of SAM.
The constructs with mutations in the linker region were more promising. Two constructs responded to variations in SAM concentrations; T1 and T2. T1 showed a fluorescence enhancement of 3.8 while T2 was enhanced by a factor of 9.6. T1 has an unmutated linker region while T2 has a mutated GC to AU-basepair. These two constructs were selected for further investigation. The Kd value was determined based on fluorescent measurements made with small increments in the addition of SAM. The results are shown in Figure 6.
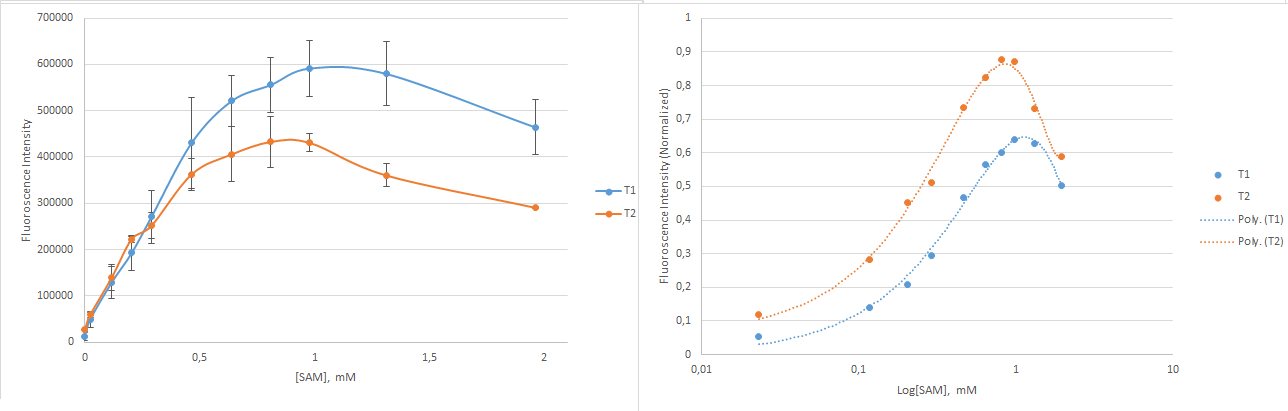
To determine the Kd value the measurements were fitted with a degree three polynomium. The Kd value was found as the concentration of SAM that lead to fluorescence at half of the maximum fluorescent intensity - that is, the concentration of SAM corresponding to 50% saturation of the construct. The Kd values were 286 µM and 202 µM for T1 and T2, respectively. The mutation in T2 made its linker region less stable than that of T1, and surprisingly more dependent on the target molecule. Counterintuitively, the least stable construct was most responsive towards the target molecule.
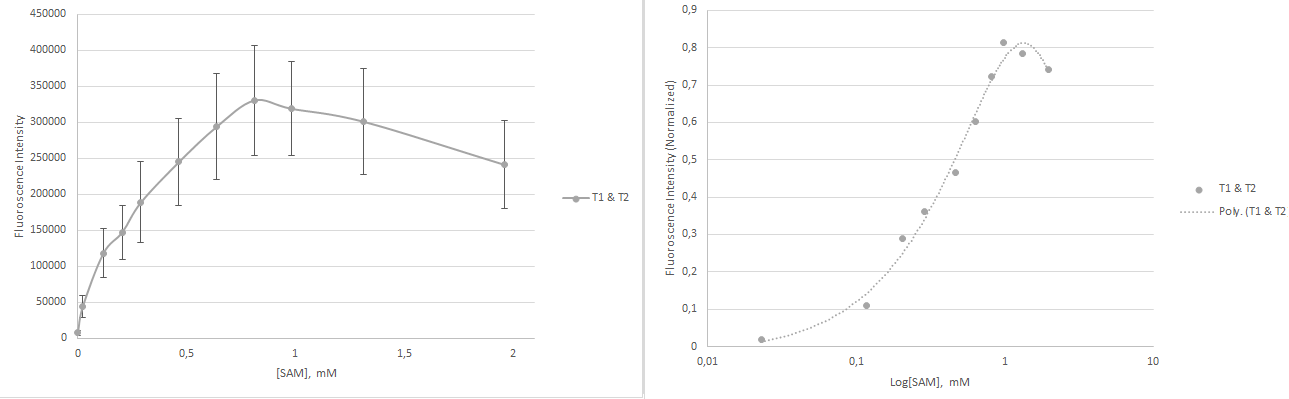
The two structures were mixed in a 1:1 ratio with a total RNA concentration of 0.26µM and measurements of the affinity were carried out. The result is shown in Figure 7. The total fluorescence was less than for the individual measurements of the constructs. It is possible that this problem could be helped by fusing the two together, as a defined construct could remove uncertainties in stoichiometry of the constructs.
The apparent Kd value was calculated to be 222 µM, which shows that it was possible to modulate the apparent Kd value by combining multiple constructs.
In conclusion we have shown that mutations in the linker region can modulate the stability of the sensors, furthermore, we have created a more sensitive construct, T2. Combining the two constructs confirmed that it was possible to modify the apparent Kd value of the total construct. This is a proof of concept for modulation of the concentration dependency. The dynamic range has been slightly increased, however, additional constructs with markedly changed affinities are needed in order to apply the sensor.
Finding orthogonal optical aptamers
Another aspect of the project is to find an orthogonal optical RNA aptamer, which should function as an internal control for the level of transcription. The aptamer should be orthogonal to the Spinach-SAM-DFHBI complex. This includes the following characteristics:- The excitation or emission wavelengths of the orthogonal aptamers must not overlap.
- The emission wavelength of one aptamer must not overlap with the excitation wavelength of the other.
- The optical RNA aptamers should not display unspecific binding to non-target ligands.
Synthesis of fluorophores and aptamers
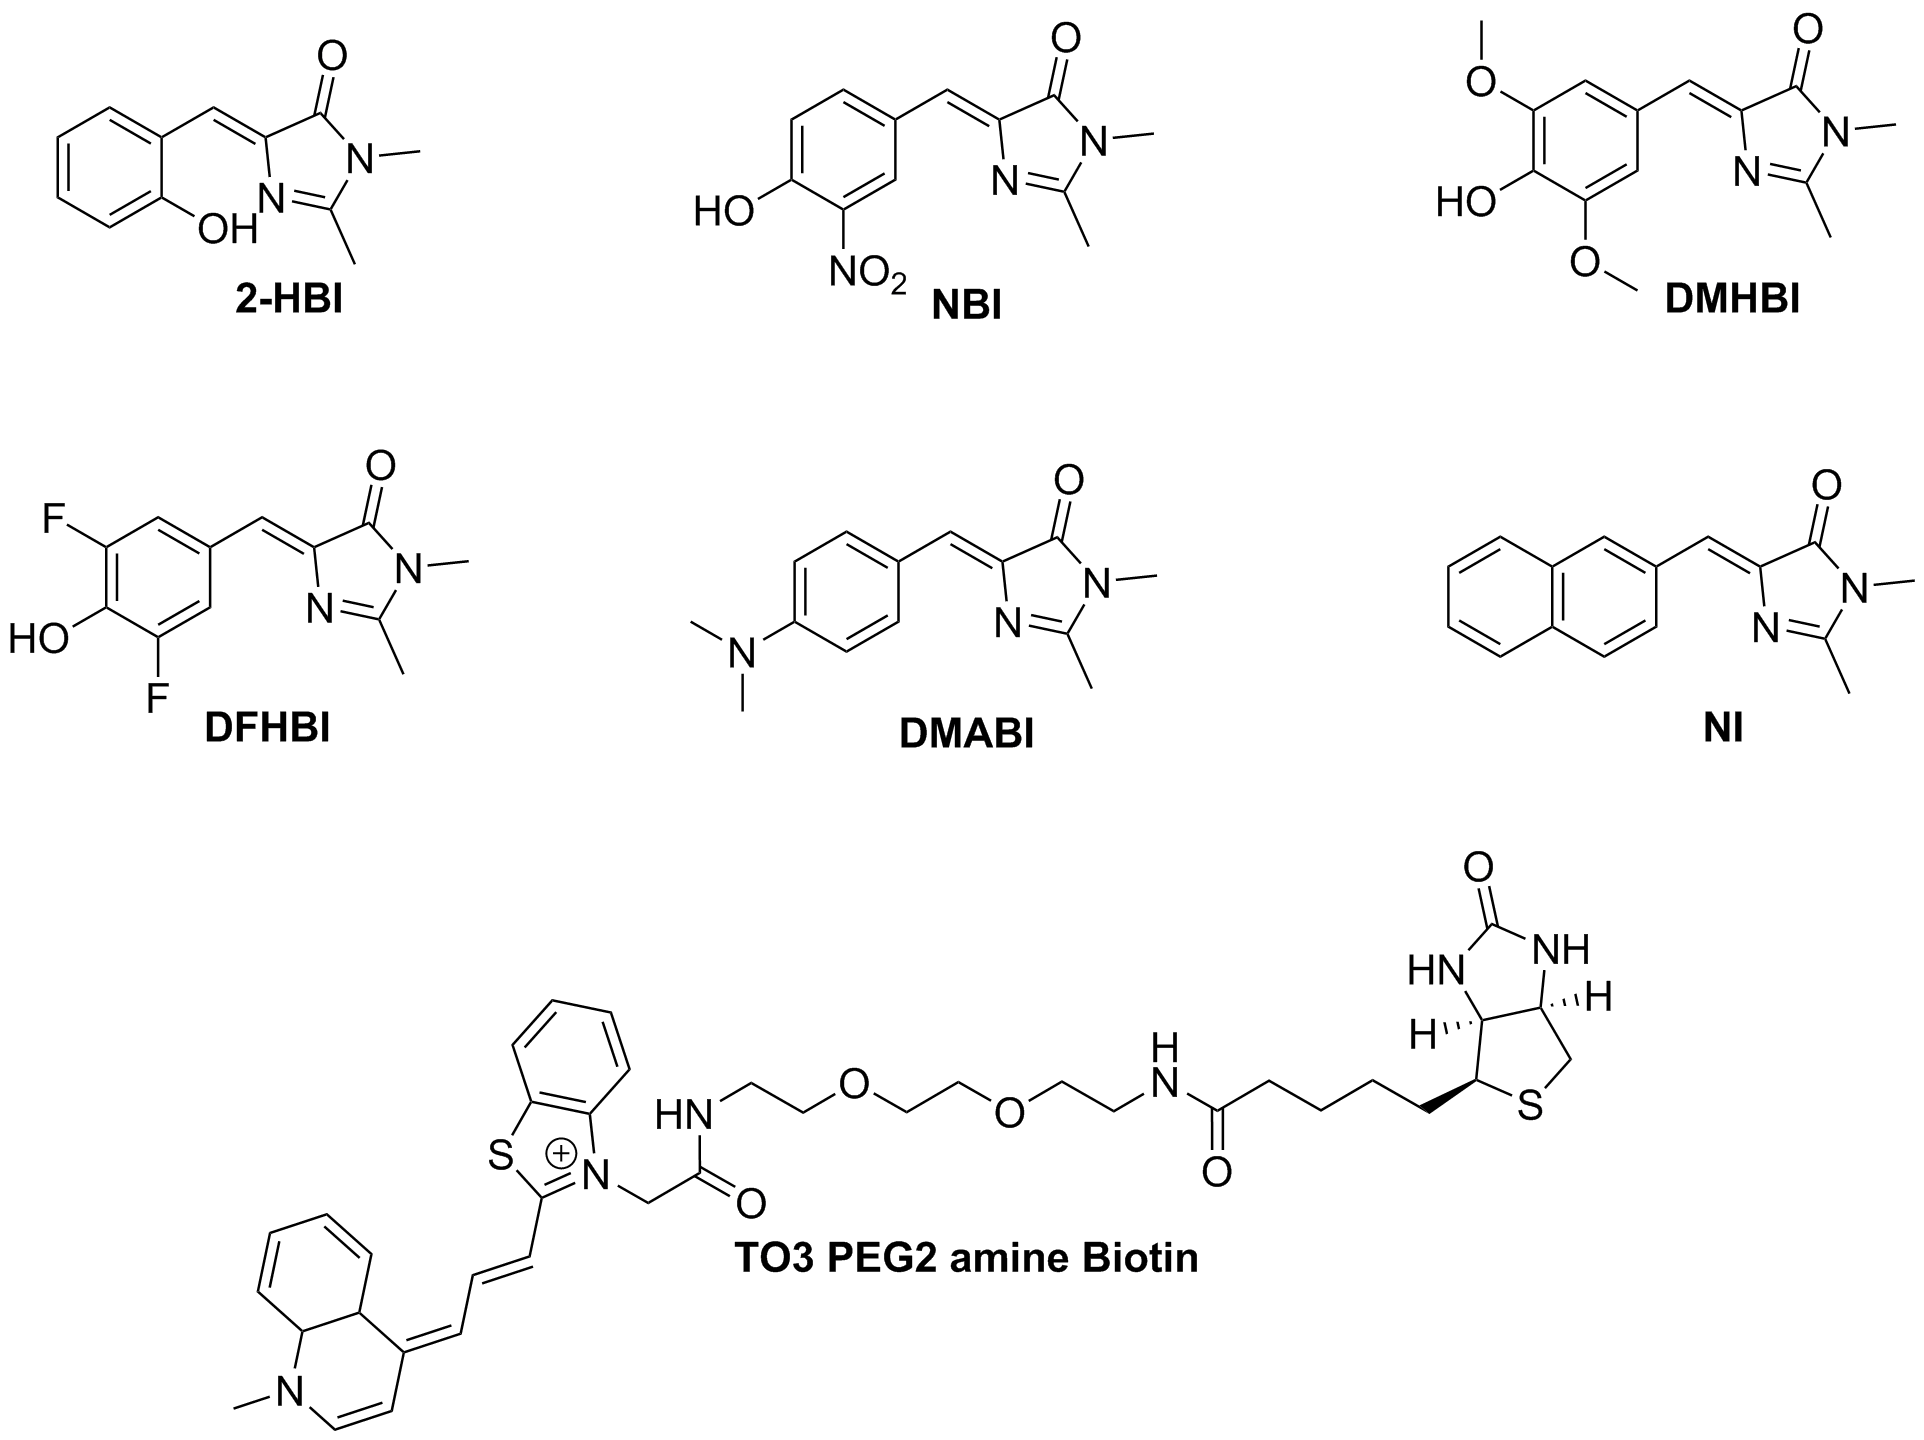
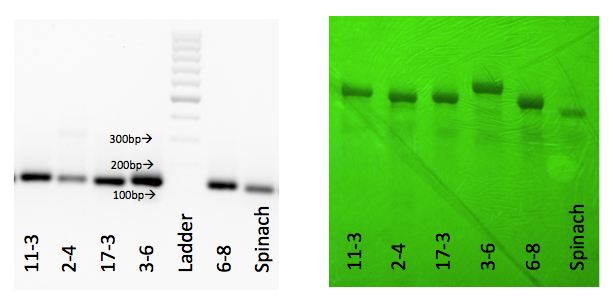
The four fluorophores, DFHBI, 2-HBI, DMHBI and DMABI from the article by Paige et. al, 2011 were synthesized. In addition to these two new fluorophore analogues were proposed and synthesized. It was anticipated that these would display a bathochromic fluorescence shift due to the extended pi network of the NI fluorophore and the NBI having a nitro-group with a hydroxyl-group acting as an auxochrome. Lastly TO3 from the article by Dolgosheina et. al was synthesized. This fluorophore binds to the optical aptamer called Mango.6 The structures of the fluorophores are shown in Figure 8. The corresponding aptamers were produced by assembly PCR, amplified by PCR and transcribed into RNA. The gels showing successful amplification are shown below.1
Evaluation of fluorophore-aptamer pairs
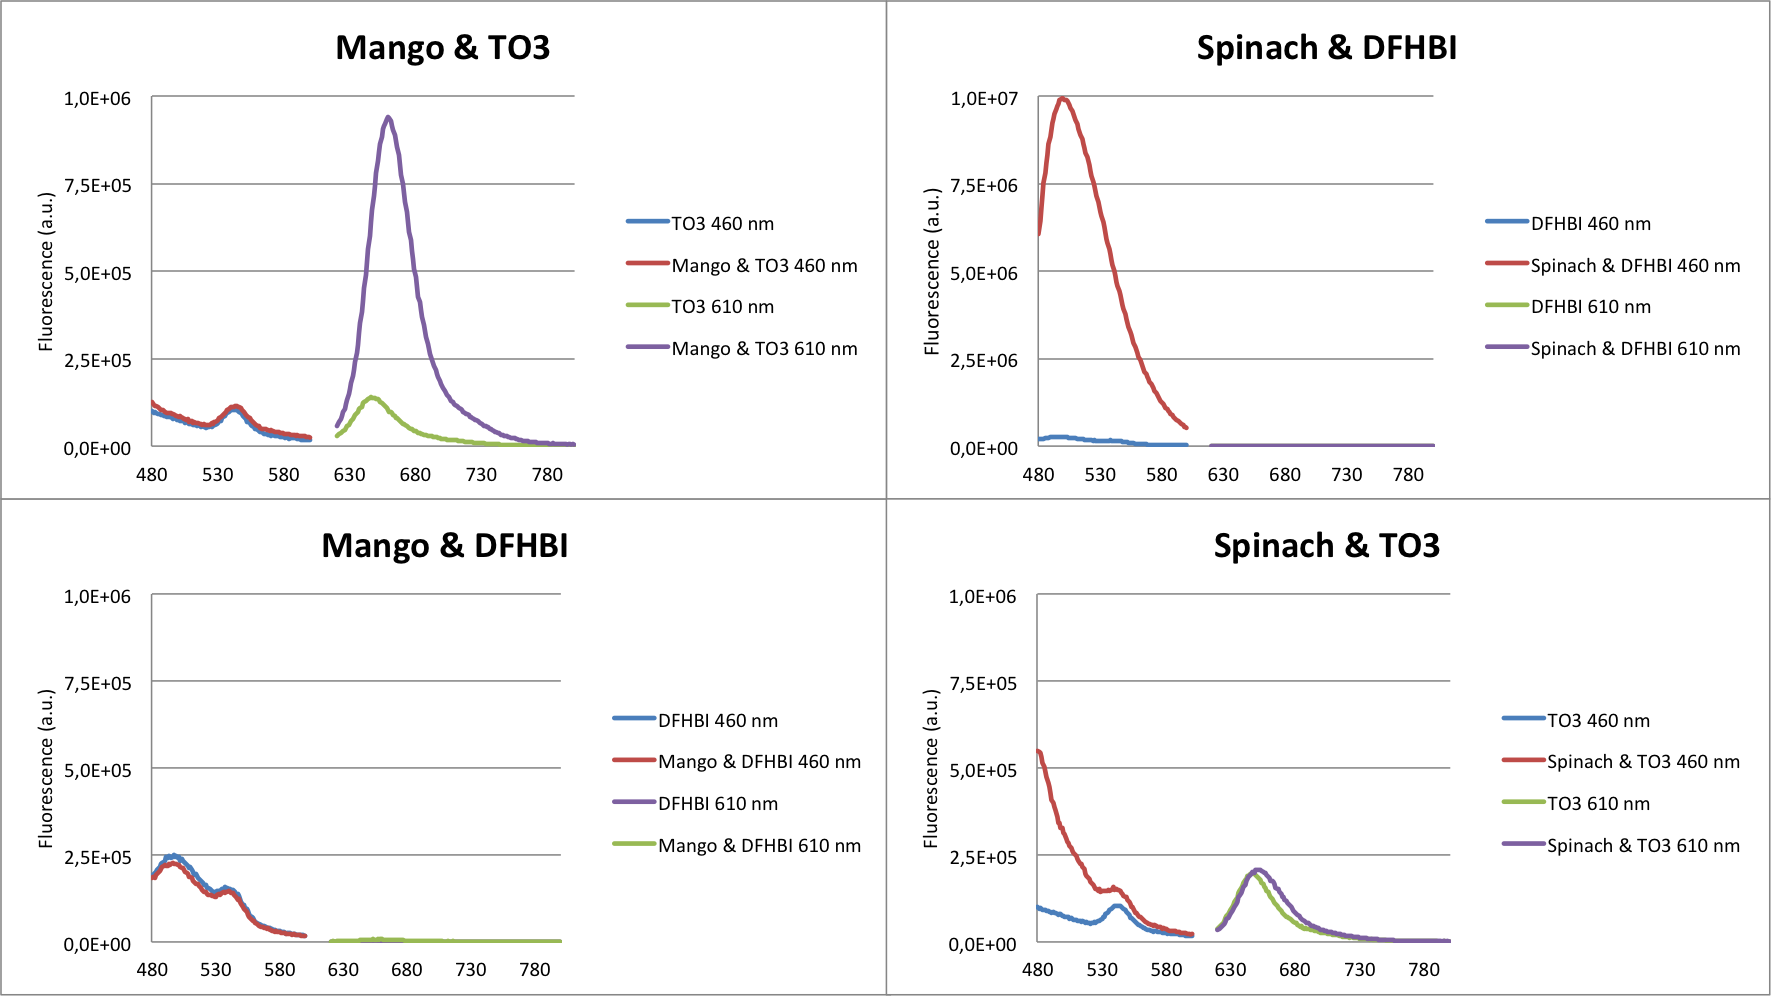
The fluorescense enhancement of the fluorophore upon aptamer binding was initially evaluated (Figure 10). The 2 new fluorophores showed no enhancement and are left out of the graph. As shown in the graph, Spinach and Mango has high fluorescence enhancements.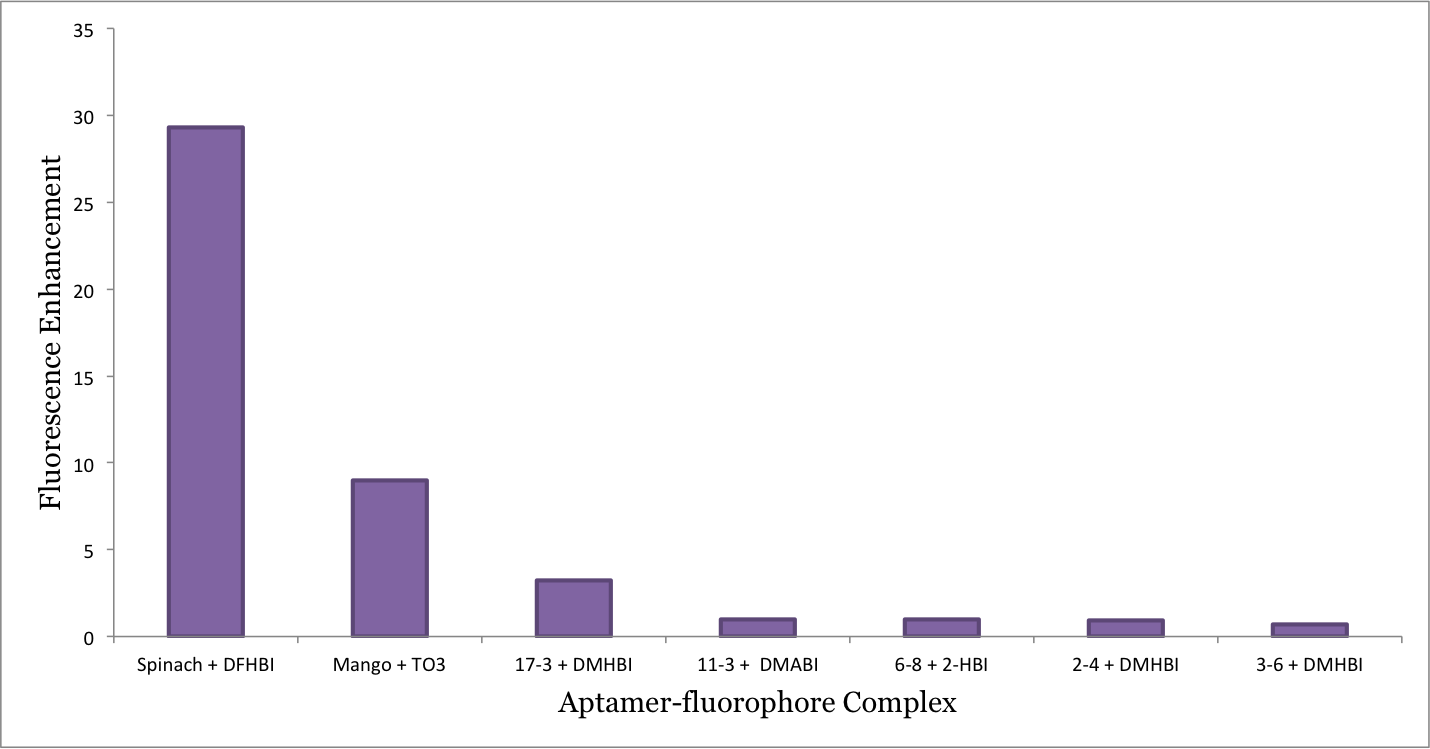
Based on these data it can be concluded that Mango will be able to serve as an internal control for our sensor.
In vivo setup
The aim was to test the concentration dependent constructs in vivo. The previously published results for in vivo fluorescence of Spinach was reproduced, however our final constructs remain to be tested.
Design and considerations
RNA is difficult to express in vivo as cells have RNases that will degrade it. This is important for the design of RNA constructs for in vivo usage. The RNA can be protected from RNases utilizing tRNA scaffolds as camouflage. The anticodon stem in the tRNA is replaced by the desired RNA insert via restriction sites as seen in Figure 13.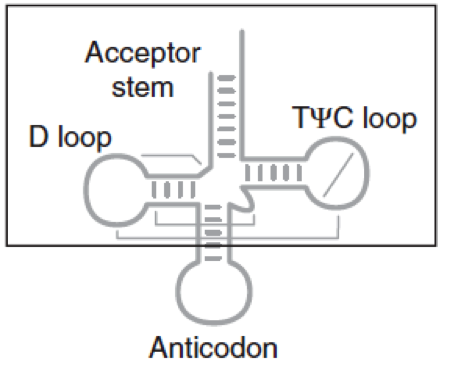
To achieve transcription of the RNA inside cells, DNA plasmids containing the DNA template were transformed into E. coli cells by electroporation. Once inside the cell, the constructs can take advantage of the host cell's transcription and processing machinery. The tRNA scaffold furthermore ensures transcription of the correct length of RNA, which usually is a problem with recombinant RNA expressed in vivo.
A plasmid containing the original Spinach-SAM construct was kindly provided by the Jaffrey lab, at Cornell University. To include a positive control for the experiments a plasmid containing only Spinach was produced. The DNA fragment containing restriction sites was made by assembly PCR using an ultramer (an ultramer a DNA strand of up to 200 bps) and two shorter oligonucleotides. This is shown in Figure 14.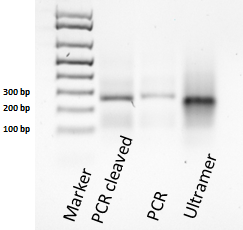
Confocal fluoroscence microscopy
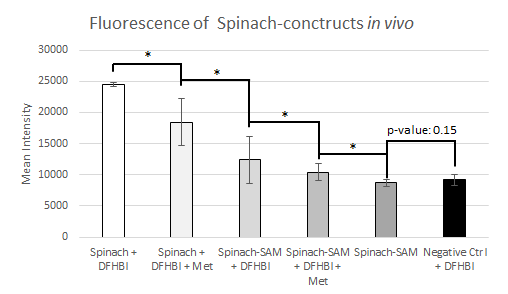
Three different constructs were tested in E. coli; Spinach, Spinach-SAM and an untransformed control. SAM is endogenously present in the cell. It can be artificially supplemented by adding methionine to the media. The results are shown in Figure 15 and Figure 16. As expected only a small amount of fluorescense was observed for the negative control containing no inserts. The positive Spinach control showed a high level of fluorescence, which was 2.7 times larger than the negative control. When adding methionine, despite our expectations the fluorescence decreased. The Spinach-SAM construct in the presence of DFHBI showed an increase in fluorescence of 1.42. When adding additional methionine the fluorescence decreased again. In the in vitro experiments it was observed that SAM concentrations above a certain treshold had a quenching effect on the fluorescence. It was hypothesized that the reduction in fluorescence might be the result of the same effect.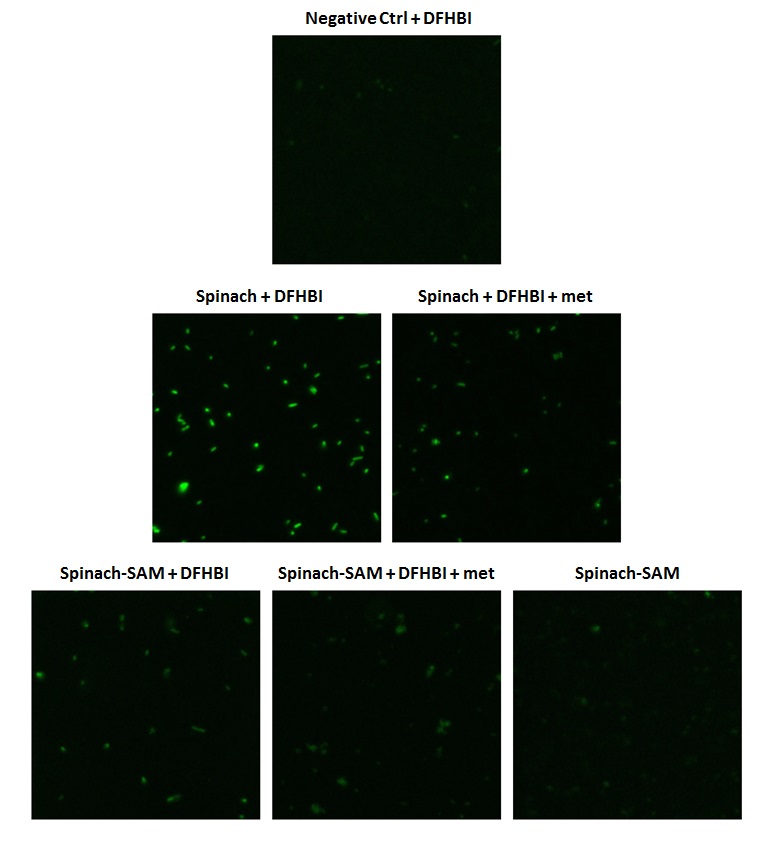
m = mean fluorescent intensity per cell, n = cell count
- Paige, J. S.; Wu, K. Y.; and Jaffrey, S. R. (2011) RNA mimics of green fluorescent protein. Science, 333, 642.
- Strack, R. L.; Disney, M. D.; and Jaffrey, S. R. (2013) A superfolding Spinach2 reveals the dynamic nature of trinucleotide repeat-containing RNA. Nat. Methods, 10, 1219−1224
- Paige, J. S.; Nguyen-Duc, T.; Song, W.; Jaffrey, S. R. (2012) Fluorescence Imaging of Cellular Metabolites with RNA. Science, 335, 1194
- Ponchon, L; Dardel, F; (2007) Nat. Methods, 4, 571-576
- Vallee-Belisle, A.; Ricci, F.; and Plaxco, K.W. (2012). Engineering biosensors with extended, narrowed, or arbitrarily edited dynamic range. J. Am. Chem. Soc. 134, 2876-2879.
- Dolgosheina, E. V; Jeng, S. C. Y.; Panchapakesan, S. S. S.; Cojocaru, R.; Chen, P. S. K.; Wilson, P. D.; Hawkins, N.; Wiggins, P. A.; Unrau, P. J. ACS Chem. Biol., 2014, 9, pp 2412–2420